

The short version
1. The exposure measures predicted the wrong casualties, in the wrong order. Of the two rankings on which much of the “AI and jobs” field relies, Felten–Raj–Seamans rates managers, analysts, and lawyers among the most at risk, and both it and Eloundou et al. score much professional work as exposed as clerical work or more. The newest federal occupational data tell a different story. The BLS Occupational Employment and Wage Statistics (OEWS), whose 2025 figures were released in May, show clerical and sales occupations breaking sharply downward while much of the professional and managerial core accelerated over the same period. When the exposure indexes are tested against realized employment change, one is modestly positively correlated with growth (+0.28) and the other is essentially noise (+0.05). If these scores measured near-term displacement risk, their relationship with employment growth should be clearly negative.
2. This means the rulers are broken, not that nothing is happening. A study that regresses employment change on these scores and finds “no measurable AI effect” may be reporting the blindness of the measure rather than the absence of an effect. If a ranking says a records clerk and an operations manager face equal displacement risk, it has misunderstood what determines whether at least one of those jobs survives automation. Analyses built on these rankings, a large share of the empirical literature, inherit that flaw.
3. But fall they did. What fell was clerical work, and the break was recent; much of the professional and managerial core accelerated. Customer service representatives, an occupation employing 2.9 million people, went from growing 3.2% a year in 2015–19 to shrinking 4.2% a year in 2023–25. Bookkeepers, receptionists, and much of the rest of SOC 43 show the same pattern, with wholesale sales representatives, another 1.3 million workers, close behind. These are not typists continuing a decline that began forty years ago. These occupations were adding workers only a few years ago and are shedding them now. The break survives industry adjustment and a battery of robustness checks: the occupations are shrinking within industries, not merely because employment is shifting away from the industries that employ them. Over the same period, much of the professional core moved in the opposite direction. Operations managers accelerated from 4.7% annual growth to 5.5%, engineers from 1.6% to 2.9%, life scientists from 2.0% to 4.1%, and lawyers continued to grow.
4. The dividing line is codifiability: how completely a job can be reduced to a specified and verifiable process. What matters is not just how many of a job’s tasks AI can touch but what remains after the touchable tasks are removed. Take those tasks out of a records clerk’s job and little of the job remains. Take the same share out of a manager’s job and the core job (judgment, responsibility, persuasion, coordination, and accountability) is still there. The exposure measures score judgment as just another potentially automatable input, while accountability and responsibility are poorly captured by task lists.
This is not the old routine-task distinction wearing new clothes. A job is vulnerable when its output can be specified, produced, and verified without preserving much human judgment, accountability, or relationship management. That is why translation, a skilled and nonroutine occupation by most traditional measures, still falls on the exposed side of the line: its output can increasingly be specified and evaluated without retaining the full human role. That is the central error in the exposure measures, and it is why they got the ordering wrong.
5. The professional exceptions confirm the principle. Graphic designers and translators declined as generative models arrived. Some finance jobs declined but not entirely due to technology. Within computing, programmers, web developers, and quality-assurance testers contracted, while software developers and data scientists continued to grow. HR specialists, market-research analysts, underwriters, and public-relations specialists stalled without contracting; HR specialists slowed from 6.6% annual growth to 1.6%. Across these cases, the casualty is the more codifiable slice of the profession (codifiable, not simple), while the neighboring role with a larger residual of judgment, ownership, or accountability kept growing. A general hiring slowdown has no reason to single out the more codifiable occupation within the same occupational family and, often, the same industries.
6. The consensus built around task-exposure rankings is wrong in both directions at once. Automation of most professional work will probably proceed more slowly over the next several years than these measures imply. Management, engineering, science, and law show little sign of displacement so far and, in many cases, accelerated. Meanwhile, the impact on codifiable work is not prospective. It is already in the data. The prevailing framework therefore appears to overstate the near-term vulnerability of many judgment-intensive professions while understating the disruption already occurring in clerical, sales, and procedural work.
7. The likeliest story is AI as an accelerant, partly hidden by the jobs it is also creating. Several of the clearest occupational declines began before the arrival of large generative models, so the mechanism is best understood as AI accelerating automation already underway, and only in some cases starting the process from nothing. The timing and breadth of the pattern are also consistent with the recent acceleration in labor productivity.
At the same time, displacement is partly masked in aggregate counts because the technologies doing the automating are also creating jobs, probably hundreds of thousands of them, including jobs in many of the same broad technical categories in which other roles are being automated. Software developers can keep growing even as programmers and testers decline because demand for building, deploying, and integrating the technology rises at the same time that the technology reduces labor requirements elsewhere. That makes the losses harder, not easier, to see.
8. Why OEWS. The OEWS covers roughly 1.1 million establishments, records occupations from employer payroll rather than worker self-description, and is large enough to examine detailed occupations crossed with industry. That feature allows the analysis to separate an occupation shrinking within industries from one merely being pulled down by shrinking industries. BLS appropriately cautions against comparisons over time. Caution remains important, but using crosswalks across vintages reduces the risk. The 2025 release makes this window newly readable, and almost nobody has read it this way.
9. Prediction. Each successive OEWS release, beginning with next year’s, will show the clerical decline deepening and the weakness spreading into paraprofessional and procedural professional work. Watch the stalls (HR specialists and underwriters) tip into outright decline, and pressure reach paralegals, junior analysts, and other roles whose output is relatively easy to specify and verify. Three occupations still growing or roughly flat in the current data that I expect to turn within two to three years are claims adjusters, compensation and benefits specialists, and cost estimators. Each is organized substantially around codifiable procedure, and each sits next to an occupation that has already stalled or declined.
These estimates should also be treated as a floor. Because the occupation-by-industry OEWS data pool three years of observations, the “2023–25” figures contain relatively little information from 2025 and none from 2026, precisely when adoption accelerated. Whatever the next release shows, it will still be catching up to what has already happened.
Method, briefly
Raw employment change mixes the occupation with its industries: a job can shrink just because its industry is shrinking. So for every occupation I strip out its industry mix, comparing its growth to the average growth of the industries it works in. What’s left, “industry-controlled” growth, is the part specific to the occupation. This removes sector-wide shocks, not every confound. Offshoring, cheaper labor, regulation, or a quietly relabeled job title can also produce a within-industry decline, so the results are consistent with technology, not proof of it. And nothing in the design can date a break to the arrival of generative AI (a broad white-collar hiring slowdown landed in the same years), so “AI specifically” is a harder claim than “technology broadly,” and I treat it that way.
One check on the headline finding: clerical work’s raw and controlled figures nearly coincide (−5.0% and −4.8%). If the decline were an artifact of clerical jobs sitting in shrinking industries, the control would have erased it, and it didn’t. I compare 2015–2019 with 2023–2025, drop the COVID years between as noise, and keep only occupations spread across enough industries for the adjustment to be identified. Occupation definitions changed with the 2018 SOC revision, so the windows are chosen not to straddle it: 2015–19 sits entirely on the old vintage, 2023–25 on the new one, and occupations are matched across the revision with a crosswalk. Where the revision split occupations too finely to match cleanly (much of computing), I don’t compare across periods. All figures are industry-controlled annualized growth, in percent per year.
The landscape
Every major occupation group (2-digit SOC), ranked by industry-controlled 2023–25 change:
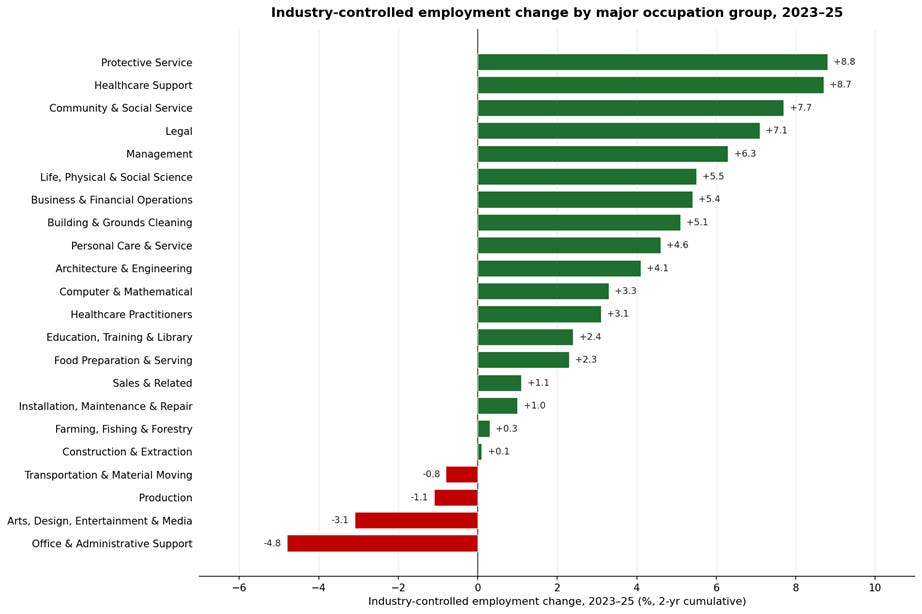
Industry-controlled employment change by major occupation group, 2023–25, fastest-growing at top. Green = growth, red = decline.
Most 2-digit SOC groups grew: this is not an economy-wide employment problem. The declines are concentrated at the bottom: Office/Admin deepest, then Arts/Media, with Production and Transportation just below zero.
The white-collar map
Moving to more granular occupation groups: 3-digit SOC groups, and restricting to white-collar work and coloring each group by its family:
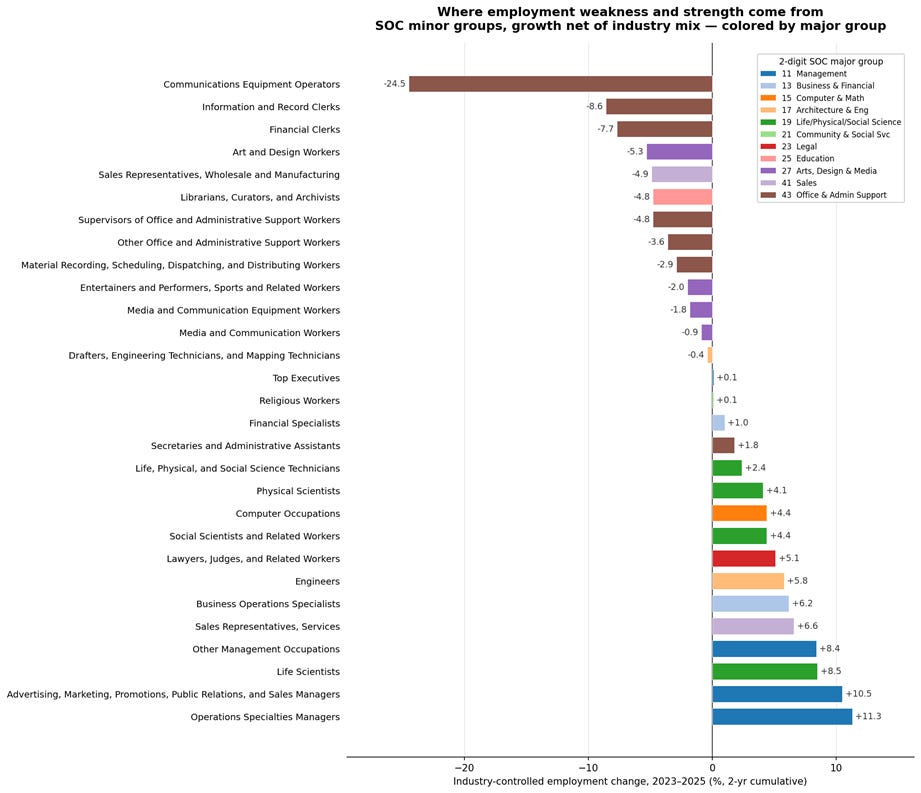
Industry-controlled change, 2023–25, for 29 white-collar occupation groups, colored by major group.
(These 29 are the white-collar groups spread across enough industries for the adjustment to work; single-industry occupations, most of healthcare and education, are missing because we can’t measure them, not because they’re safe.)
Clerical and creative work is on the deficit side; managerial, scientific, and analytical work is on the growth side. Office/Admin flipped from growth to decline, while the groups the exposure indices rank as most at risk barely moved or sped up. The actual ordering isn’t just uncorrelated with the exposure ordering. It’s close to inverted.
The measurement problem
The two instruments the “AI and jobs” literature actually runs on are the Felten–Raj–Seamans AI Occupational Exposure index and Eloundou et al.’s “GPTs are GPTs” language-model exposure score. If exposure predicted displacement, plotting it against realized change would slope downward.
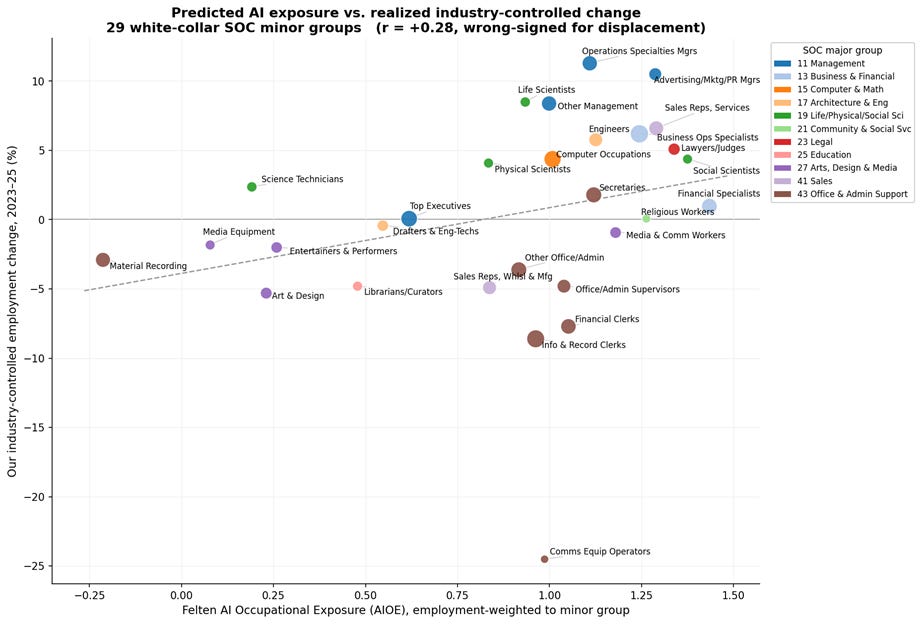
Felten exposure (x) versus realized industry-controlled change (y). The fitted line slopes upward.
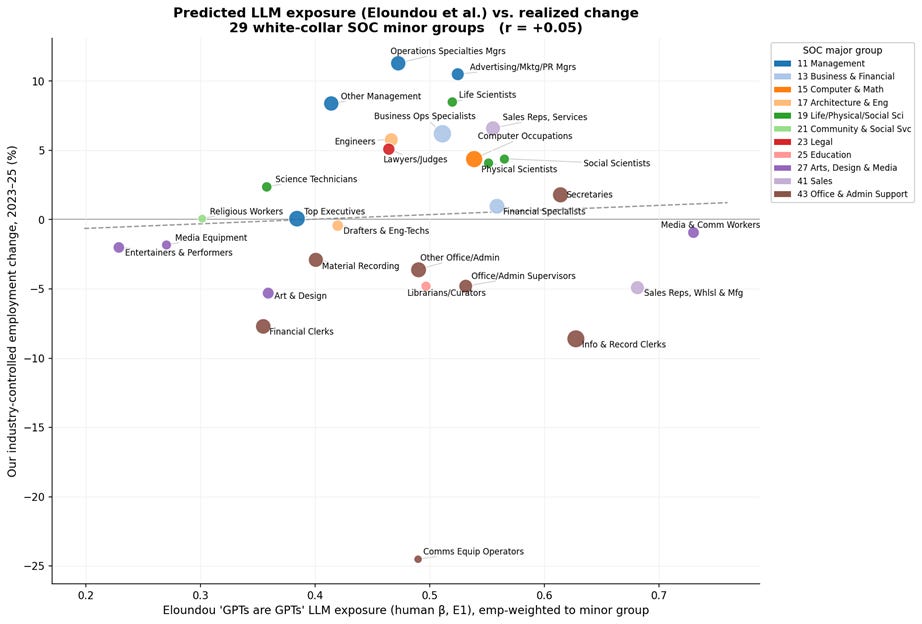
Eloundou LLM exposure versus the same change: no relationship at all.
Displacement would require a clearly negative correlation. Instead, Felten’s is modestly positive (+0.28); it flags the jobs that grew. Eloundou’s is indistinguishable from noise (+0.05). On the Felten index, the occupations rated most exposed (managers, analysts, lawyers) cluster among the occupations that grew, while the actual decliners sit at middling exposure. The Eloundou score does put some clerical work near the top, and it still nets to zero, because much of the professional growth scores high too. Both correlations are computed unweighted across the 29 groups; weighting by employment pushes Felten’s further positive and leaves Eloundou’s near zero.
There are two ways to read this. First, exposure is sign-blind: the scores measure whether AI can reach a job’s work, not whether the job contracts, so “replaces this worker” and “augments this worker” get the same high score, a limitation the Eloundou authors state themselves. Second, the ranking itself may be wrong. The inventories these measures are built on do list judgment and decision-making, but the measures score judgment as one more thing AI can touch, which pushes managers up the exposure ranking; and accountability, the other thing that separates a manager and most professionals from a records clerk, is a property of the position rather than a task, so it appears on no task list at all. Either way, a study that regresses employment on exposure and finds nothing has mostly tested its own measure. That verdict is about the scores as predictors of near-term displacement; they may still capture which jobs AI will change, as opposed to shrink. I’ll come back to what the rankings miss once the evidence is on the table.
What fell: the sign-flip
The clearest result is the contraction of codifiable office work. The point isn’t that clerical jobs are declining; they’ve been declining for forty years. What’s new is the sign-flip: occupations that grew through 2015–19 turned negative in 2023–25. Information & Record Clerks went from +0.8 to −4.4; Art & Design from +2.8 to −2.7; Office/Admin supervisors from +1.2 to −2.4, all relative to their own industries. That’s a recent break, not an old trend continuing.
Table 1 — White-collar occupation groups, both periods (industry-controlled, %/yr)
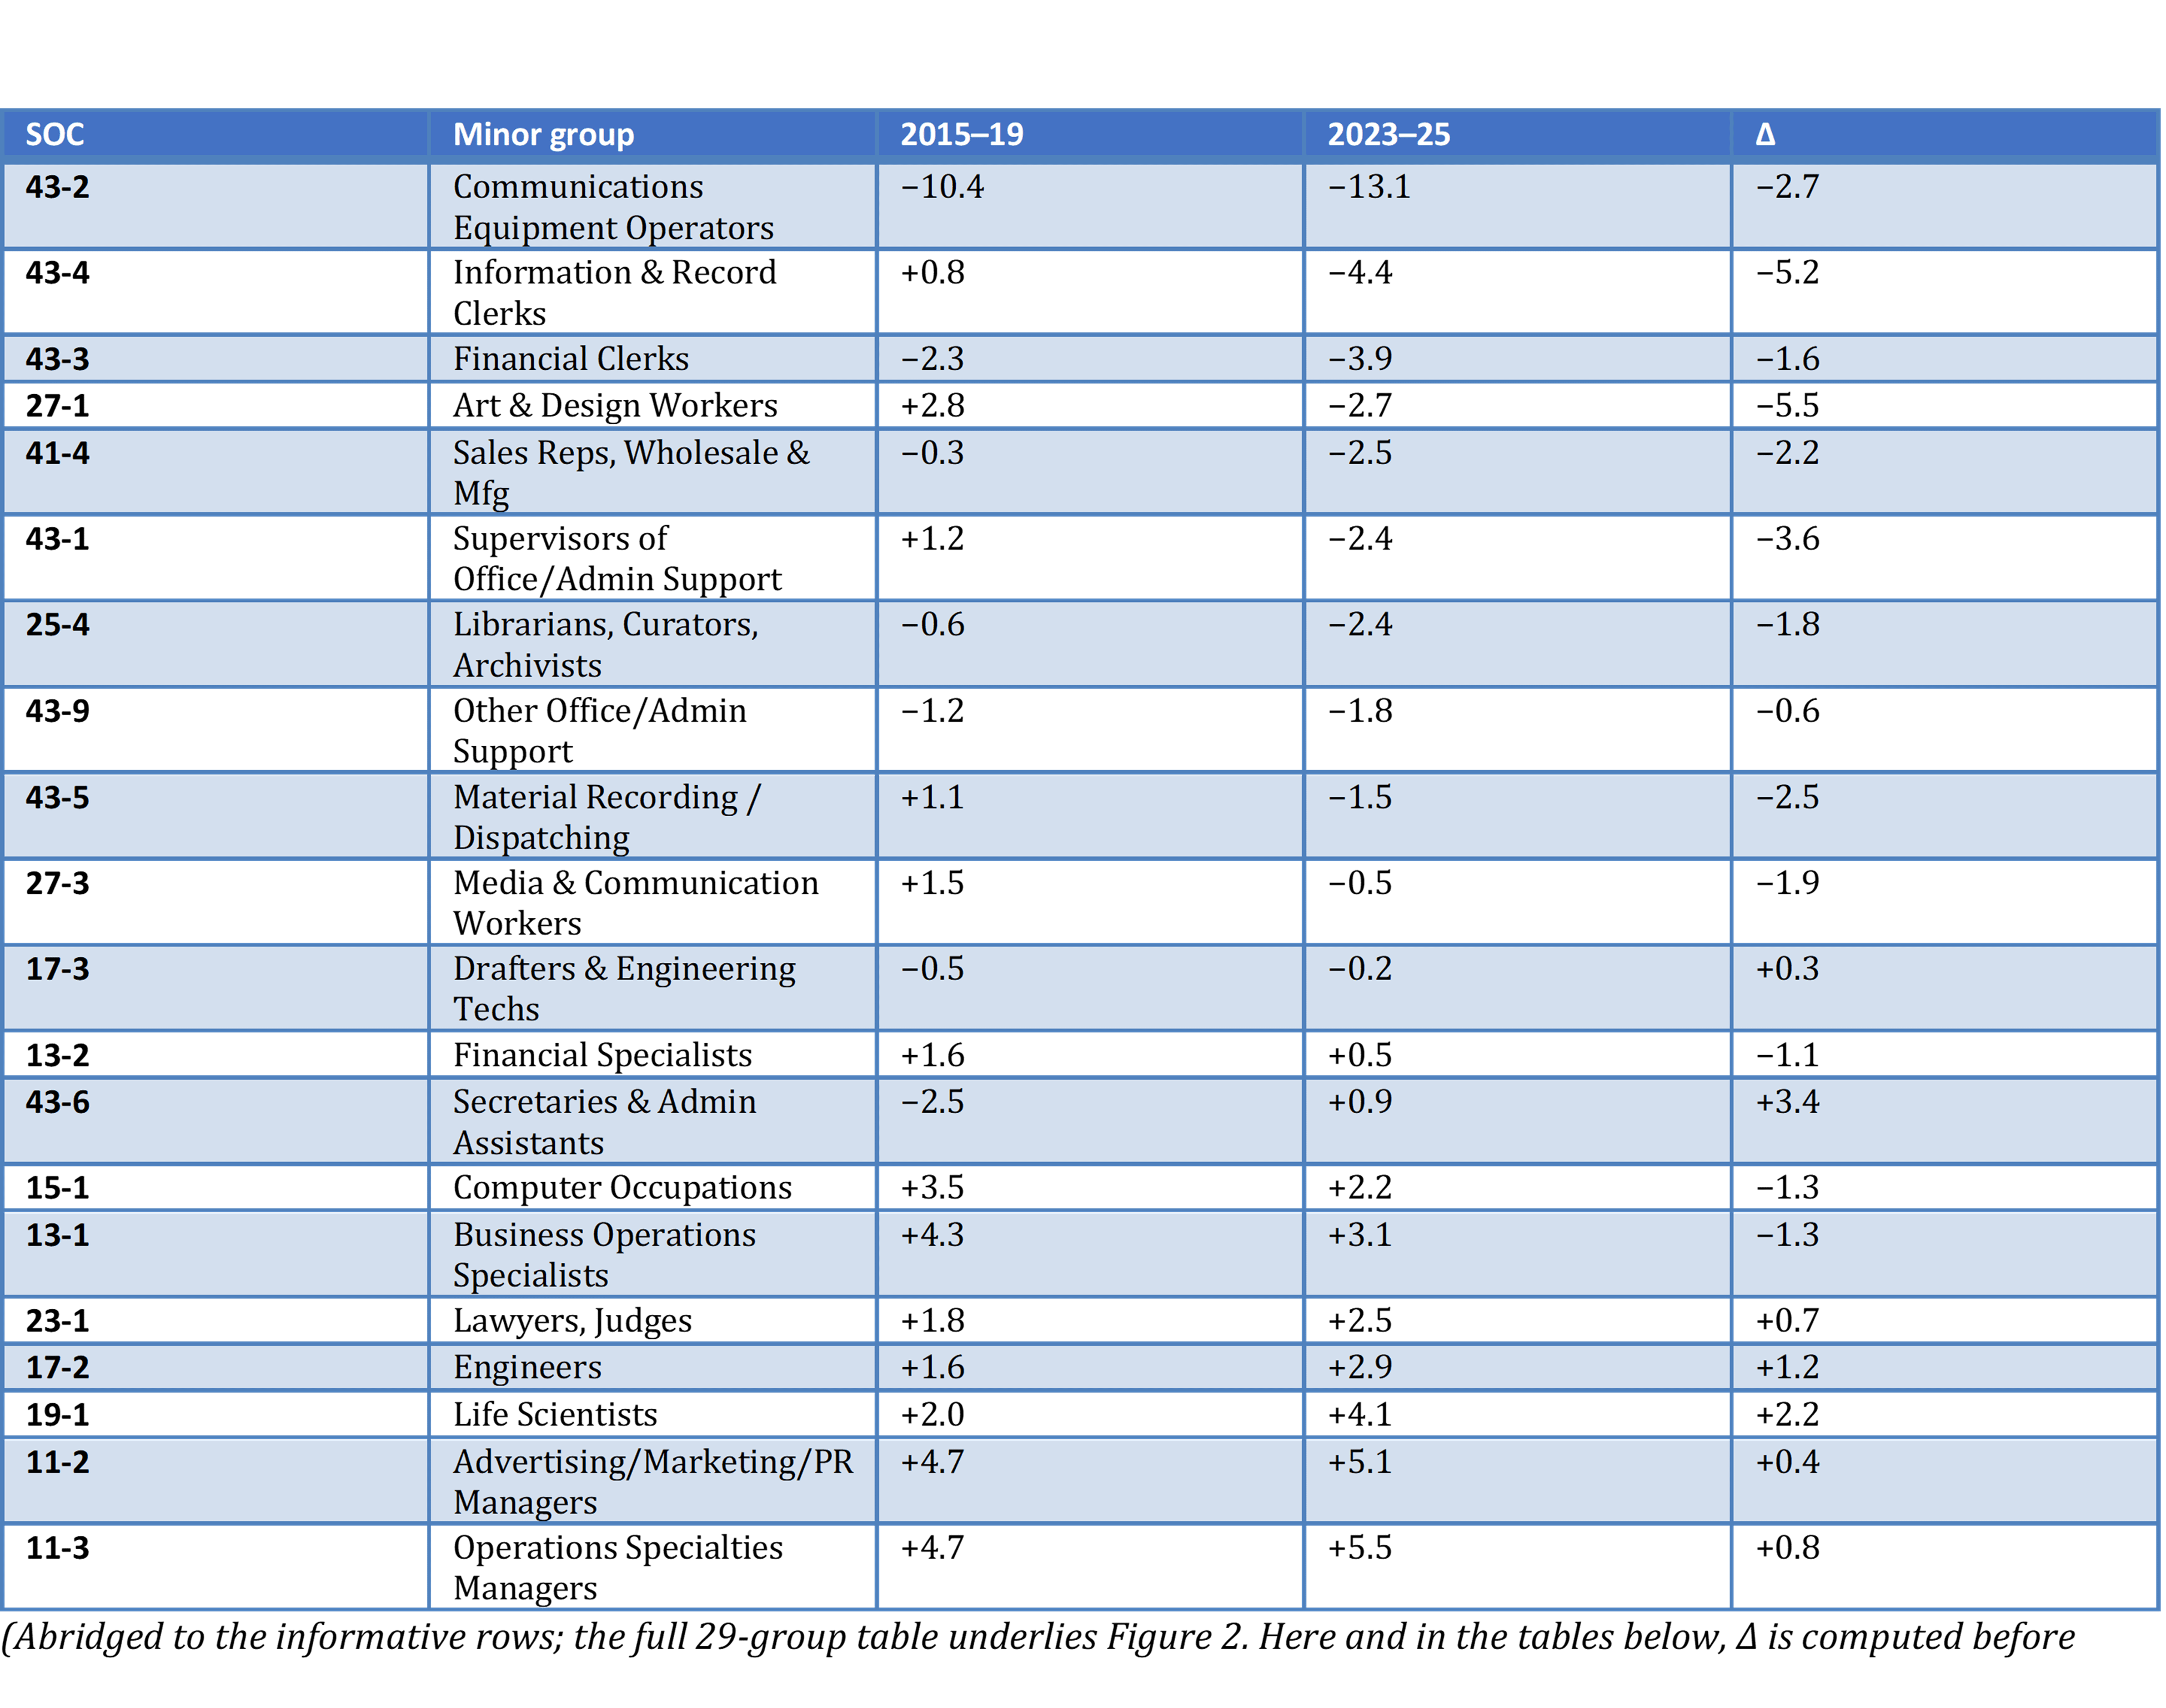
(Abridged to the informative rows; the full 29-group table underlies Figure 2. Here and in the tables below, Δ is computed before rounding, so it can differ from the displayed columns by 0.1.)
The individual occupations inside Office/Admin are the biggest jobs in the economy:
Table 2 — The largest Office/Admin occupations
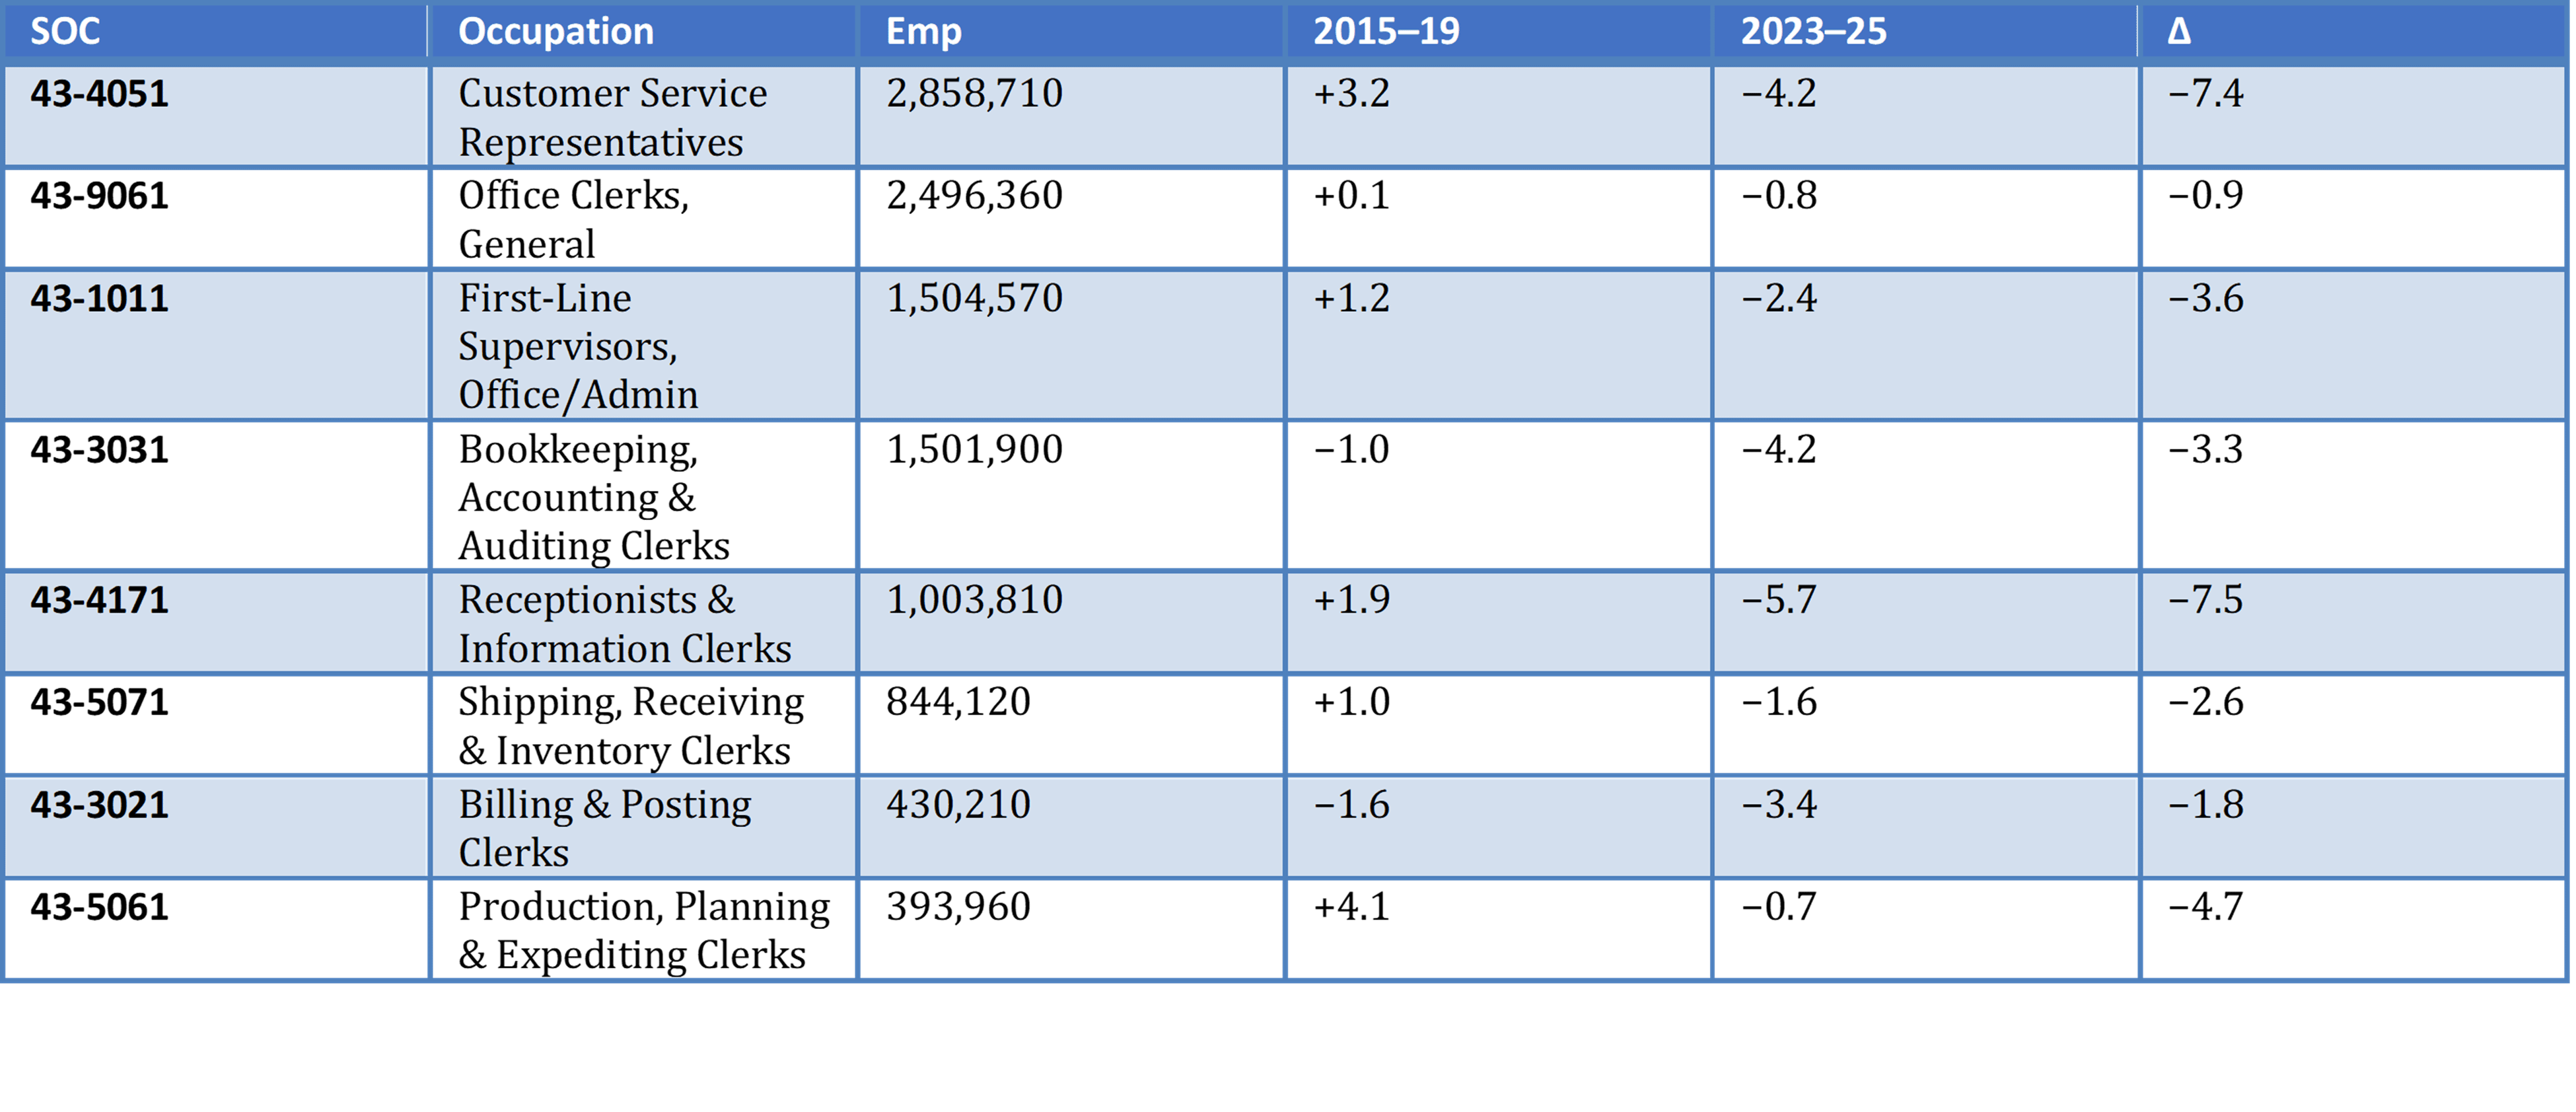
Customer service representatives, 2.9 million people, swung more than seven points, from +3.2 to −4.2, and the decline is statistically robust. Bookkeeping clerks and admin supervisors show the same reversal; the supervisors fall because there are fewer clerks left to supervise. None of this needs an exotic story: chatbots and self-service portals deflect customer contacts, and accounting software automates the reconciliation clerks used to do.
One caveat: the generalist, Office Clerks, General (2.5 million), barely moved, and its change isn’t statistically distinguishable from zero. The occupations that fell hardest are the specialized, codifiable ones; the harder a role is to reduce to procedure, the better it held. Even the exception fits, though I concede this reading is post-hoc: secretaries, the icon of the previous automation wave, are one of the few clerical groups improving (−2.5 to +0.9). My conjecture is that the earlier wave already stripped out the codifiable tasks, and the secretaries who remain do judgment and coordination work.
Beyond the office: sales reps and object obsolescence
The biggest casualty outside SOC 43 gets the least attention: wholesale and manufacturing sales reps, 1.6 million workers across the two lines at the top of Table 3, disintermediated as procurement moves to portals and marketplaces. The percentage declines are modest, but the headcount makes this one of the largest absolute losses in the data, and nothing else obvious happened to wholesale selling. (Telemarketers, contracting around 14% a year, probably belong here too, but the estimate is weakly identified and I don’t lean on it.)
Table 3 — Sales and non-white-collar occupations with plausible technology causes
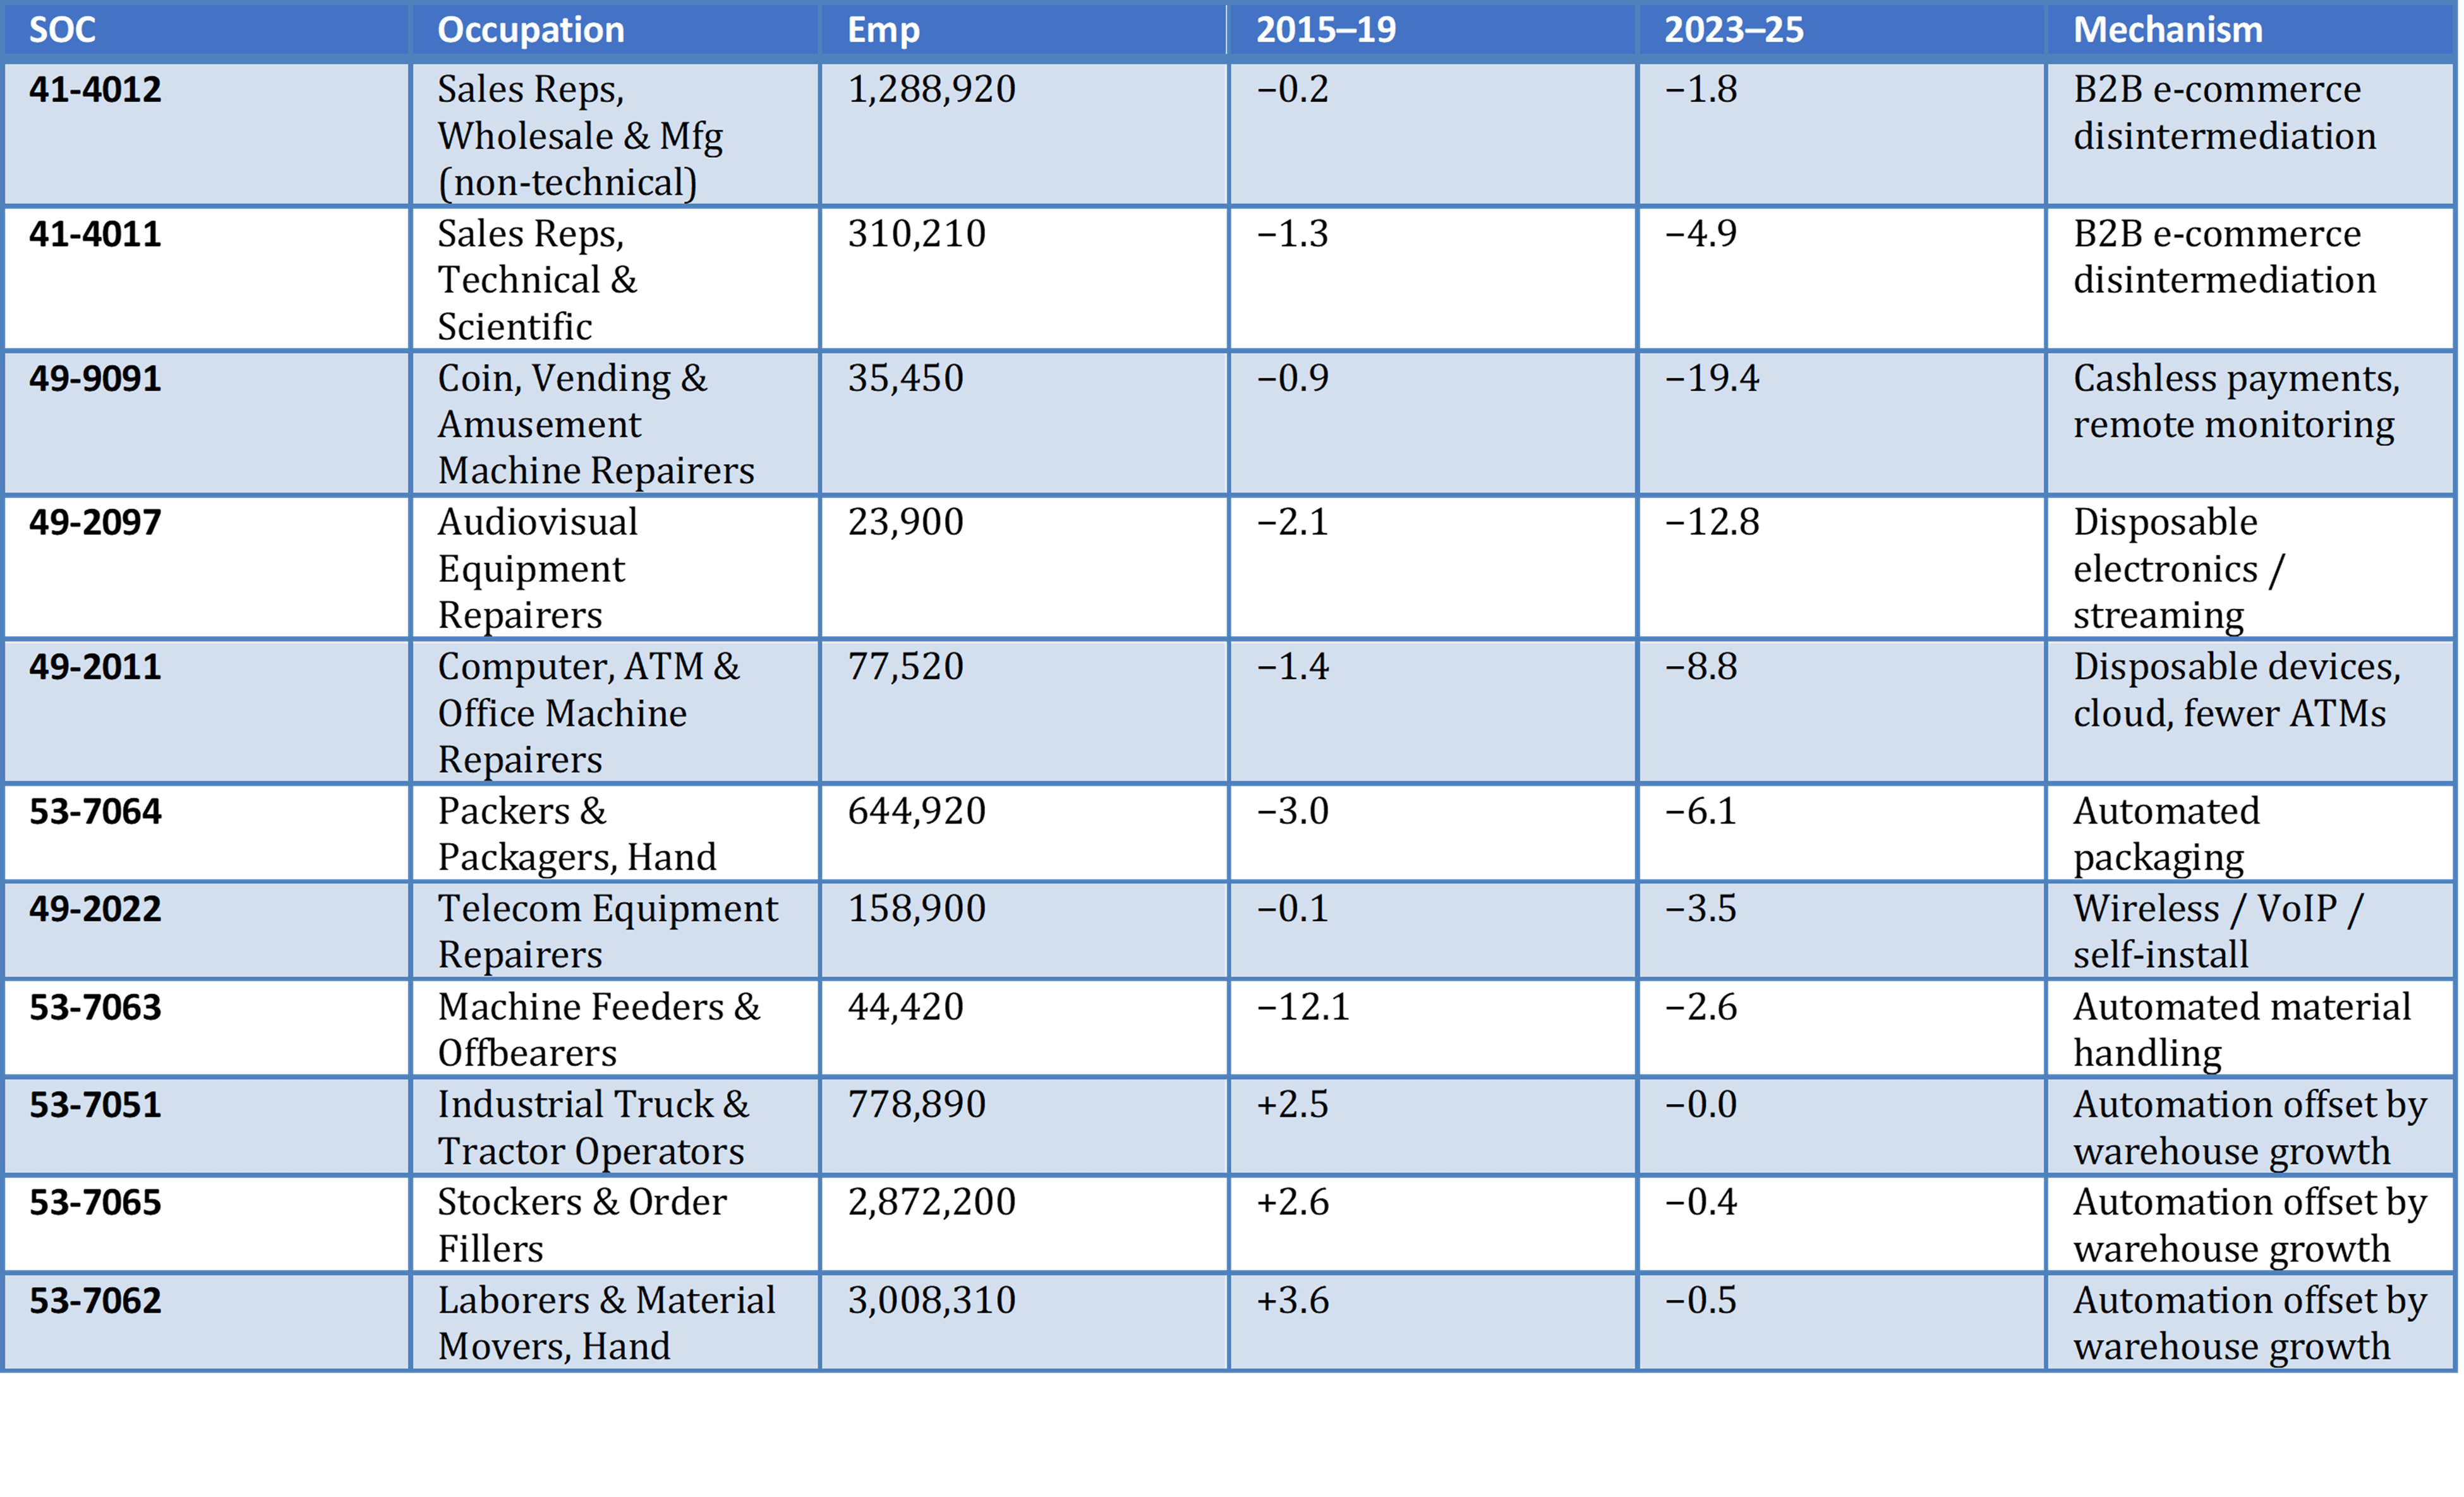
Below the sales rows, outside white-collar work entirely, sit some of the steepest technology declines in the economy, and the story there is not just AI. Something different is happening in some occupations, object obsolescence: technology doesn’t automate the task, it deletes the thing the job was about. Cashless payments and remote monitoring are emptying out vending-machine repair. Disposable electronics and streaming ended AV repair; digital documents and cloud computing ended office-machine repair.
The material-moving occupations at the bottom are the counterexample: hand laborers, stockers, and forklift operators, the jobs everyone assumes robots are taking, grew through 2015–19 and are basically flat in 2023–25 once industry is controlled; the warehouse sector expanded fast enough to offset whatever automation did inside it. The one physical case that survives the control is hand packagers, replaced by automated packaging lines.
What didn’t fall
The other side of the gap is just as plain. Management, engineering, and science accelerated through the same window: Operations Specialties Managers went from +4.7%/yr to +5.5, Engineers from +1.6 to +2.9, Life Scientists from +2.0 to +4.1, Lawyers from +1.8 to +2.5. Business Operations Specialists eased from +4.3 to +3.1, a slowdown from a boom. These are the occupations the exposure indices rank as most at risk, and they hold the growth end of Table 1. Whatever is thinning the clerical layer has not reached the jobs built on judgment, accountability, and ownership of outcomes, or not yet; the exceptions are why I add the qualifier.
The professional exceptions, sorted by evidence
Some professional occupations did get hit, and they share a shape. You have to read this at the occupation level; group averages hide it: Drafters & Engineering Technicians nets out to −0.2%/yr while inside it drafters fall at −3 to −8 under CAD and engineering technicians grow on infrastructure spending. The cases differ sharply in quality of evidence, so: clean technology mechanisms first, then the stalls, then the cases where another shock dominates.
Table 4 — Professional occupations with strong technology evidence
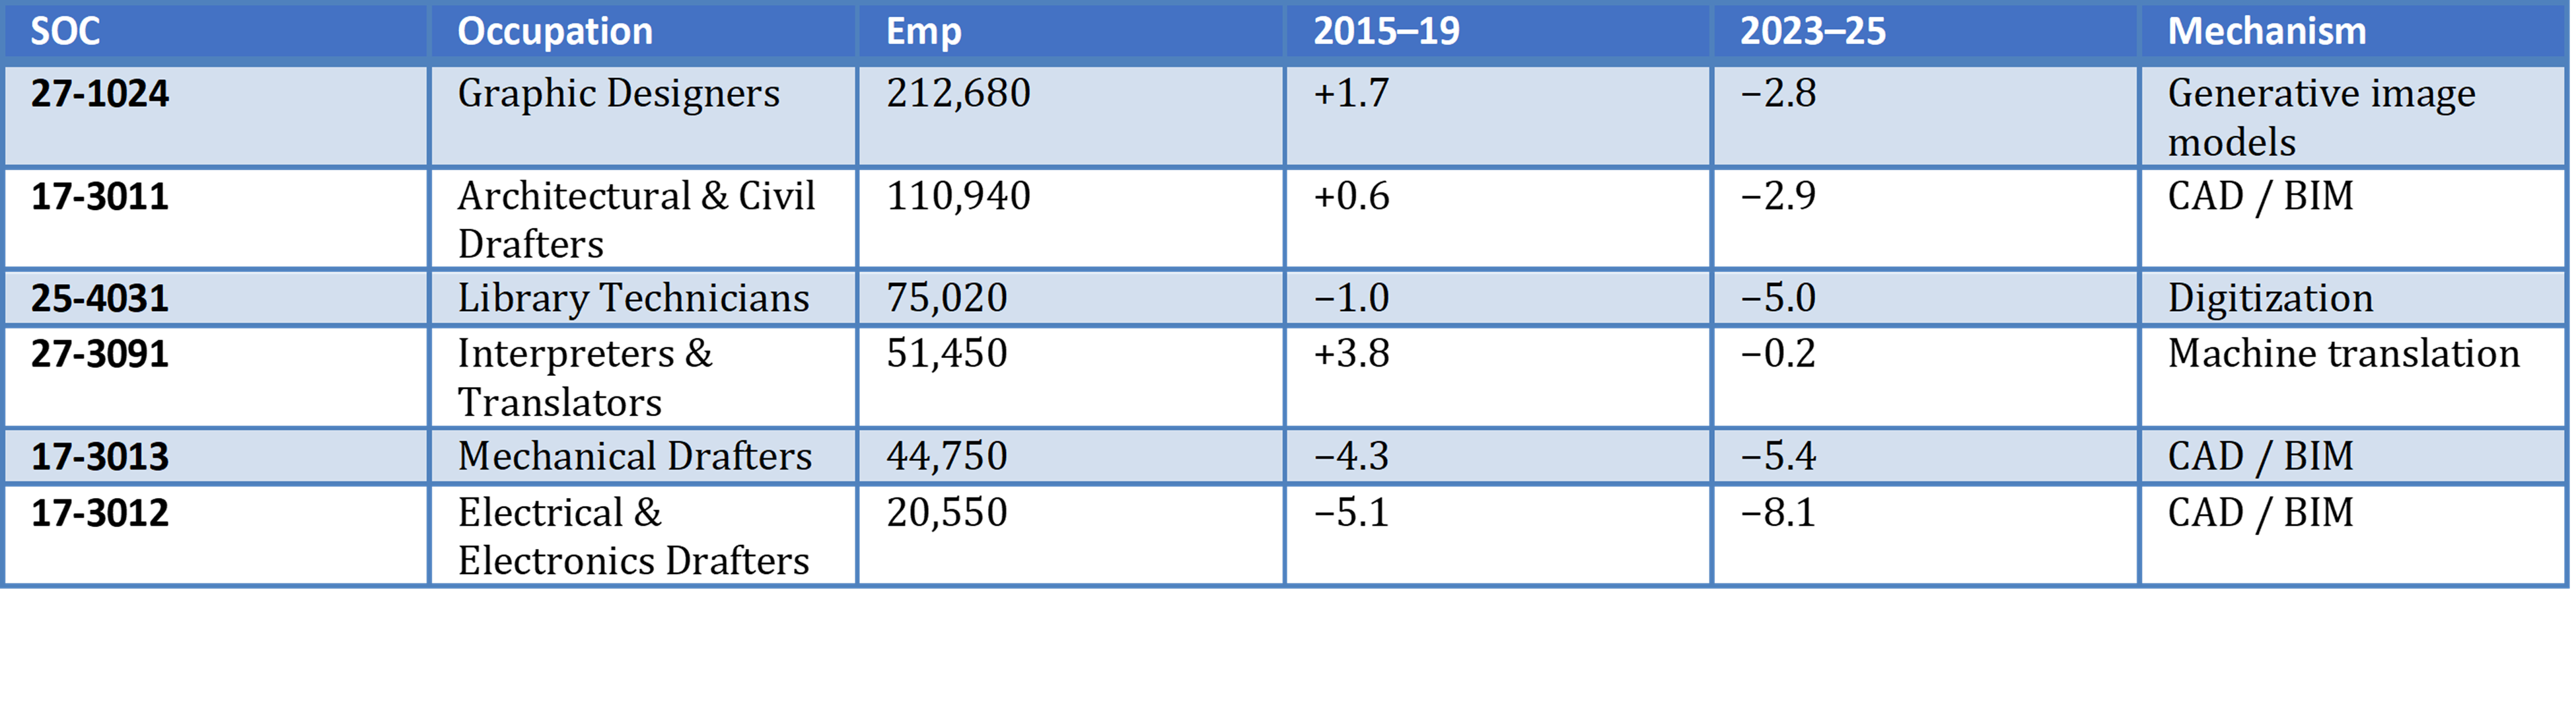
Graphic designers and translators are the cleanest generative-AI cases: the tasks map directly onto the technology, the timing matches, and there’s no competing shock. (A caution: OEWS misses freelancers.) The drafters and library technicians are partly older technology declines, not entirely news about AI.
Table 5 — The stalls: occupations that almost stopped growing
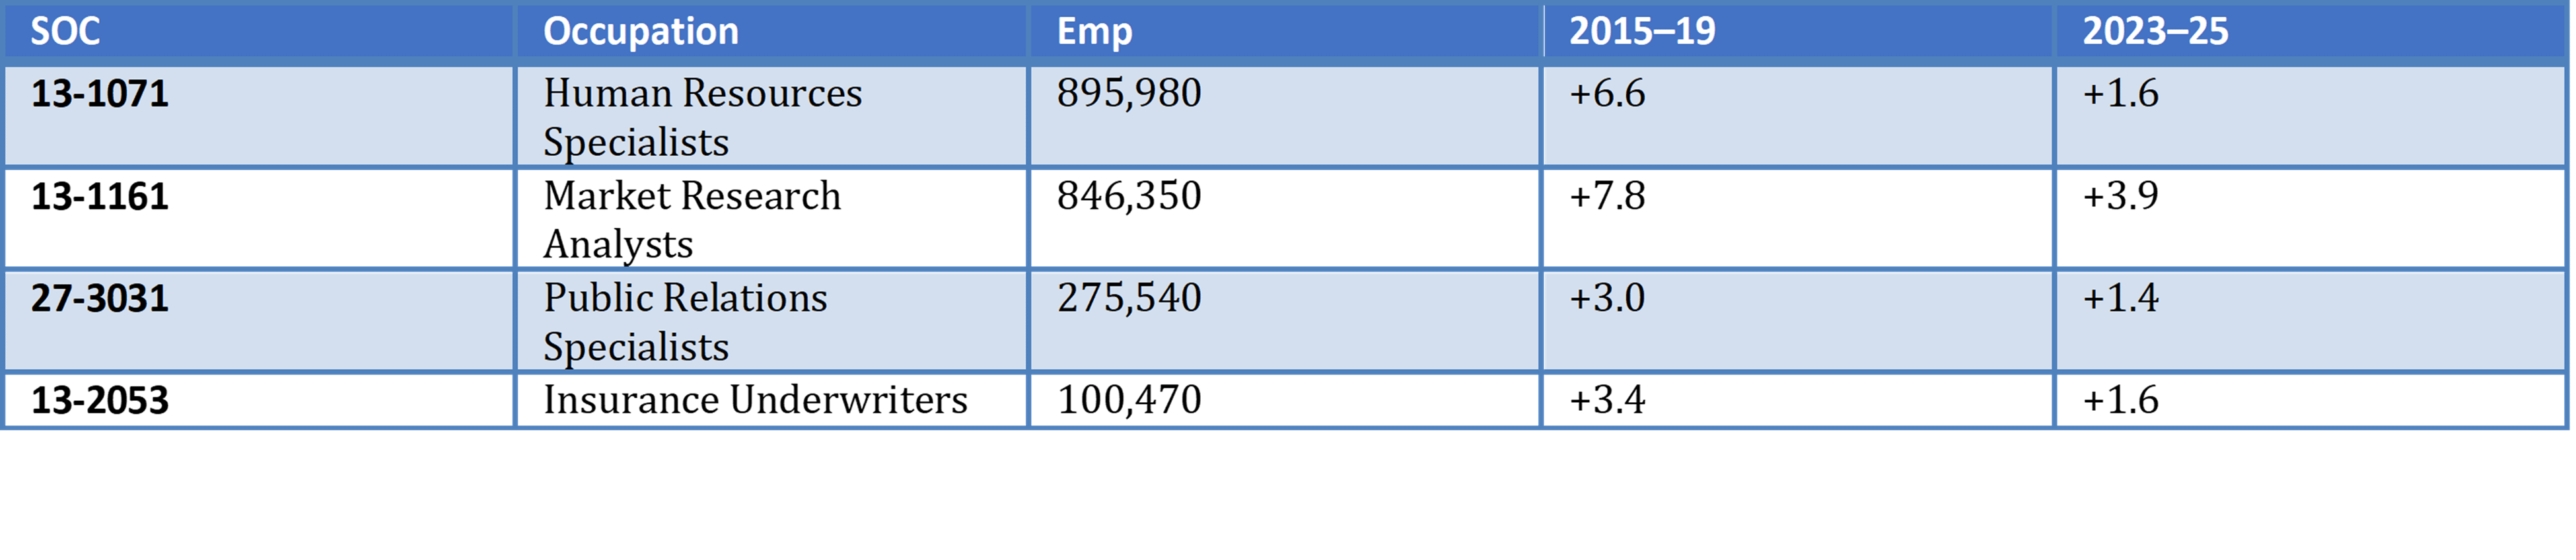
As evidence, the stalls are weaker than the declines; a slowdown from a boom can have many causes. As a signal, I think they matter more. These are exactly the roles where workflow automation is arriving (screening software in recruiting, algorithmic underwriting), and what they show is strong growth evaporating while headcount holds. If the technology story is right, the stalls are where the next declines come from. That’s why the forecast at the end is built around them.
Table 6 — Dramatic declines that at least partly belong to other stories
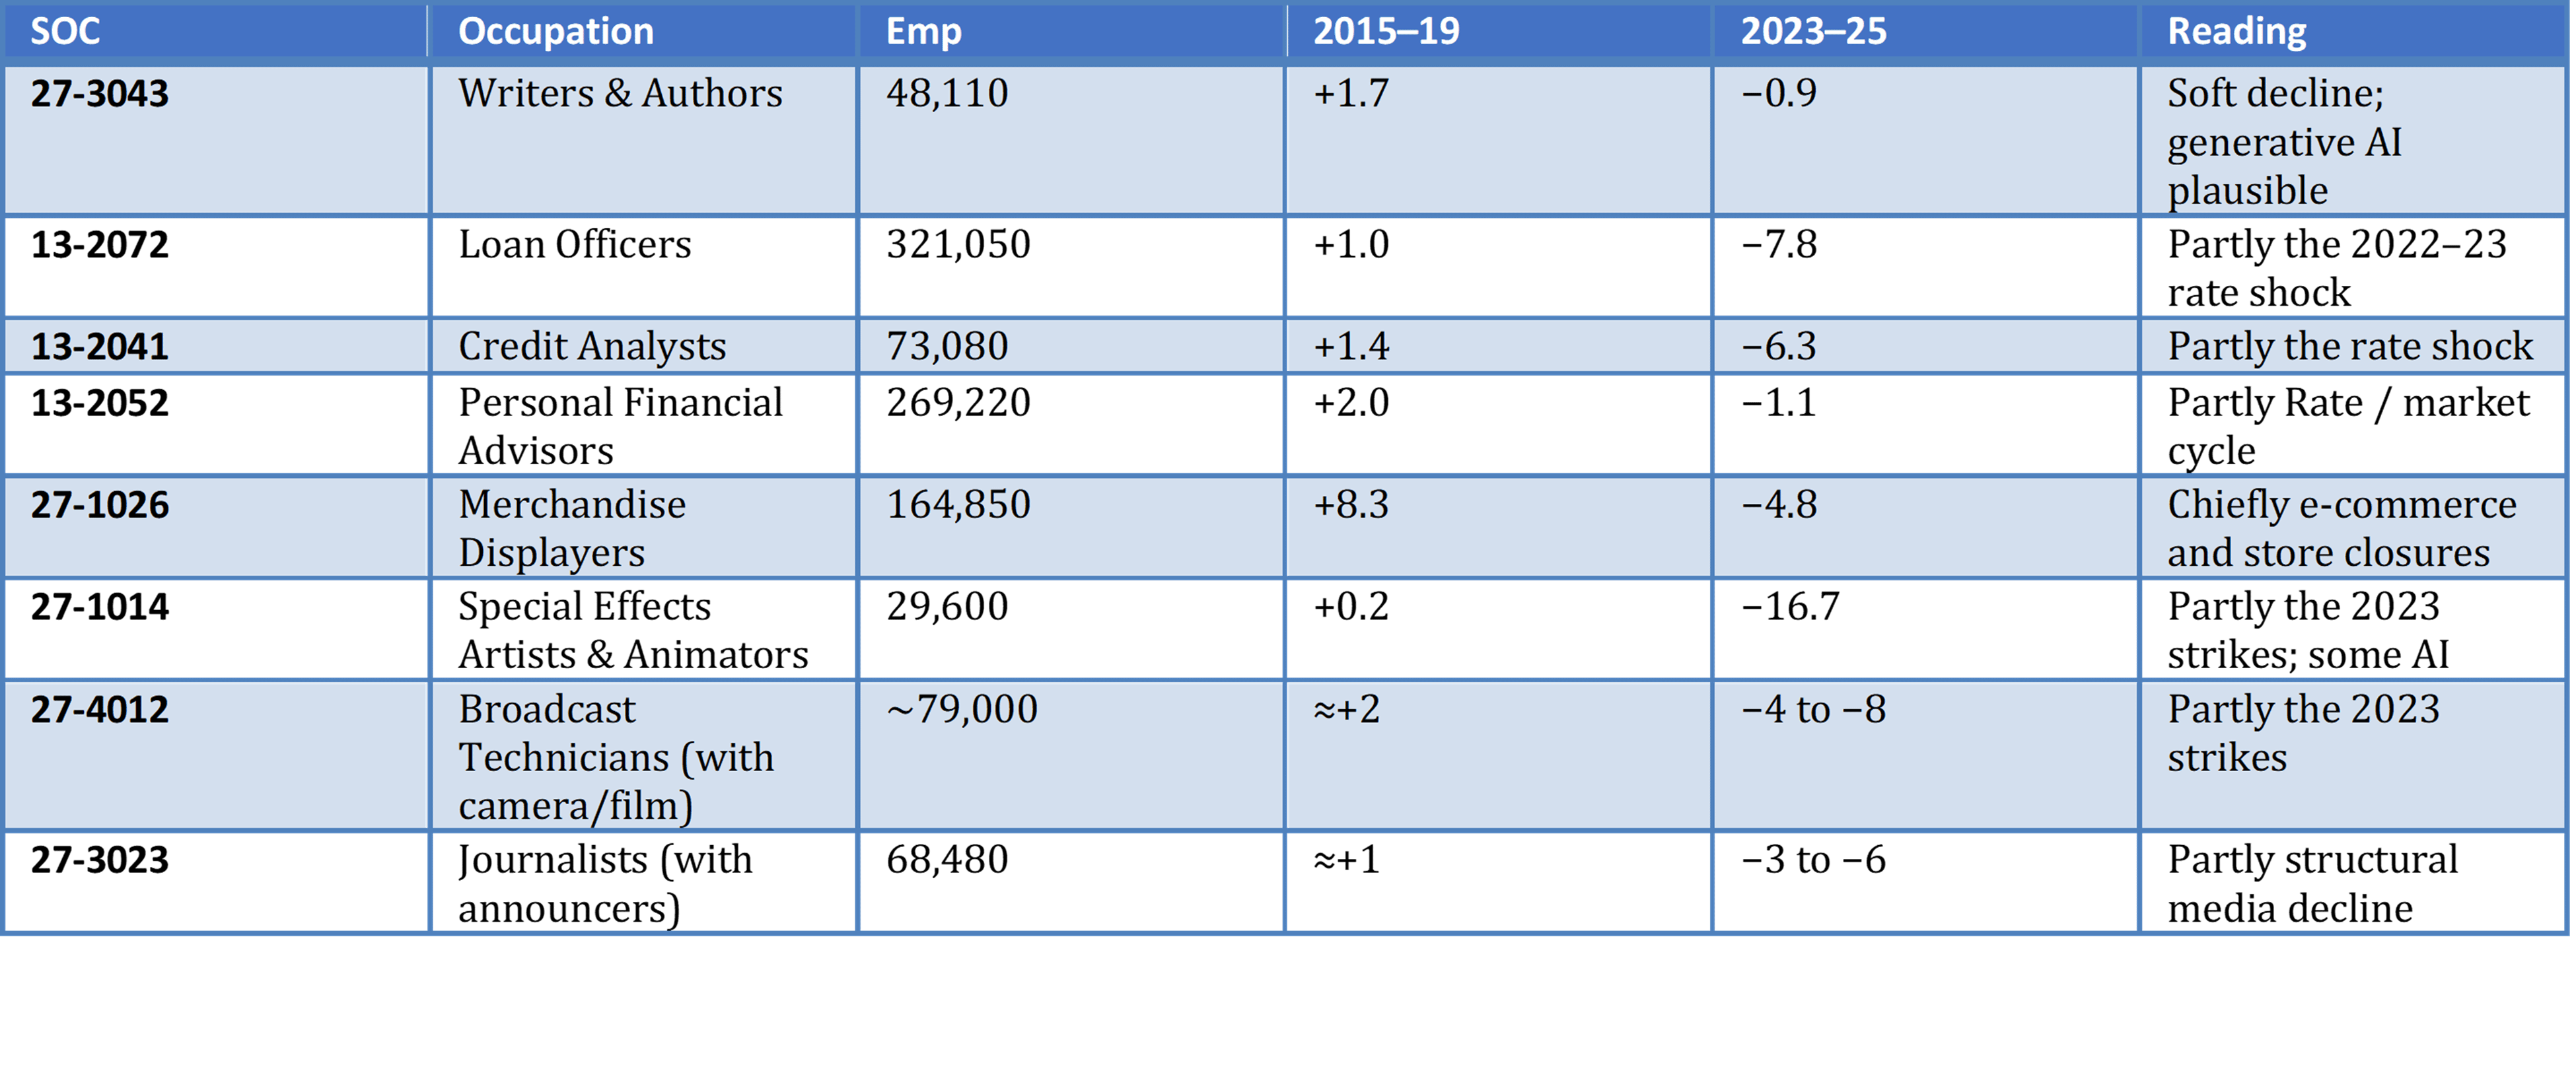
These rows carry big numbers, and they don’t entirely survive scrutiny. The lending cluster is partly the 2022–23 rate shock collapsing loan volume; there’s an automation layer beneath it, but the two can’t be separated here. The film and TV decline coincides with the 2023 strikes. Merchandise displayers reflect store closures. I keep them in, labeled, so you can see I’m not cherry-picking.
The last exception is the most technical field there is: computer occupations, the obvious place to look for AI displacing its own creators. Software employment isn’t collapsing; it’s recomposing.
Table 7 — Declining computer & math occupations, 2023–25
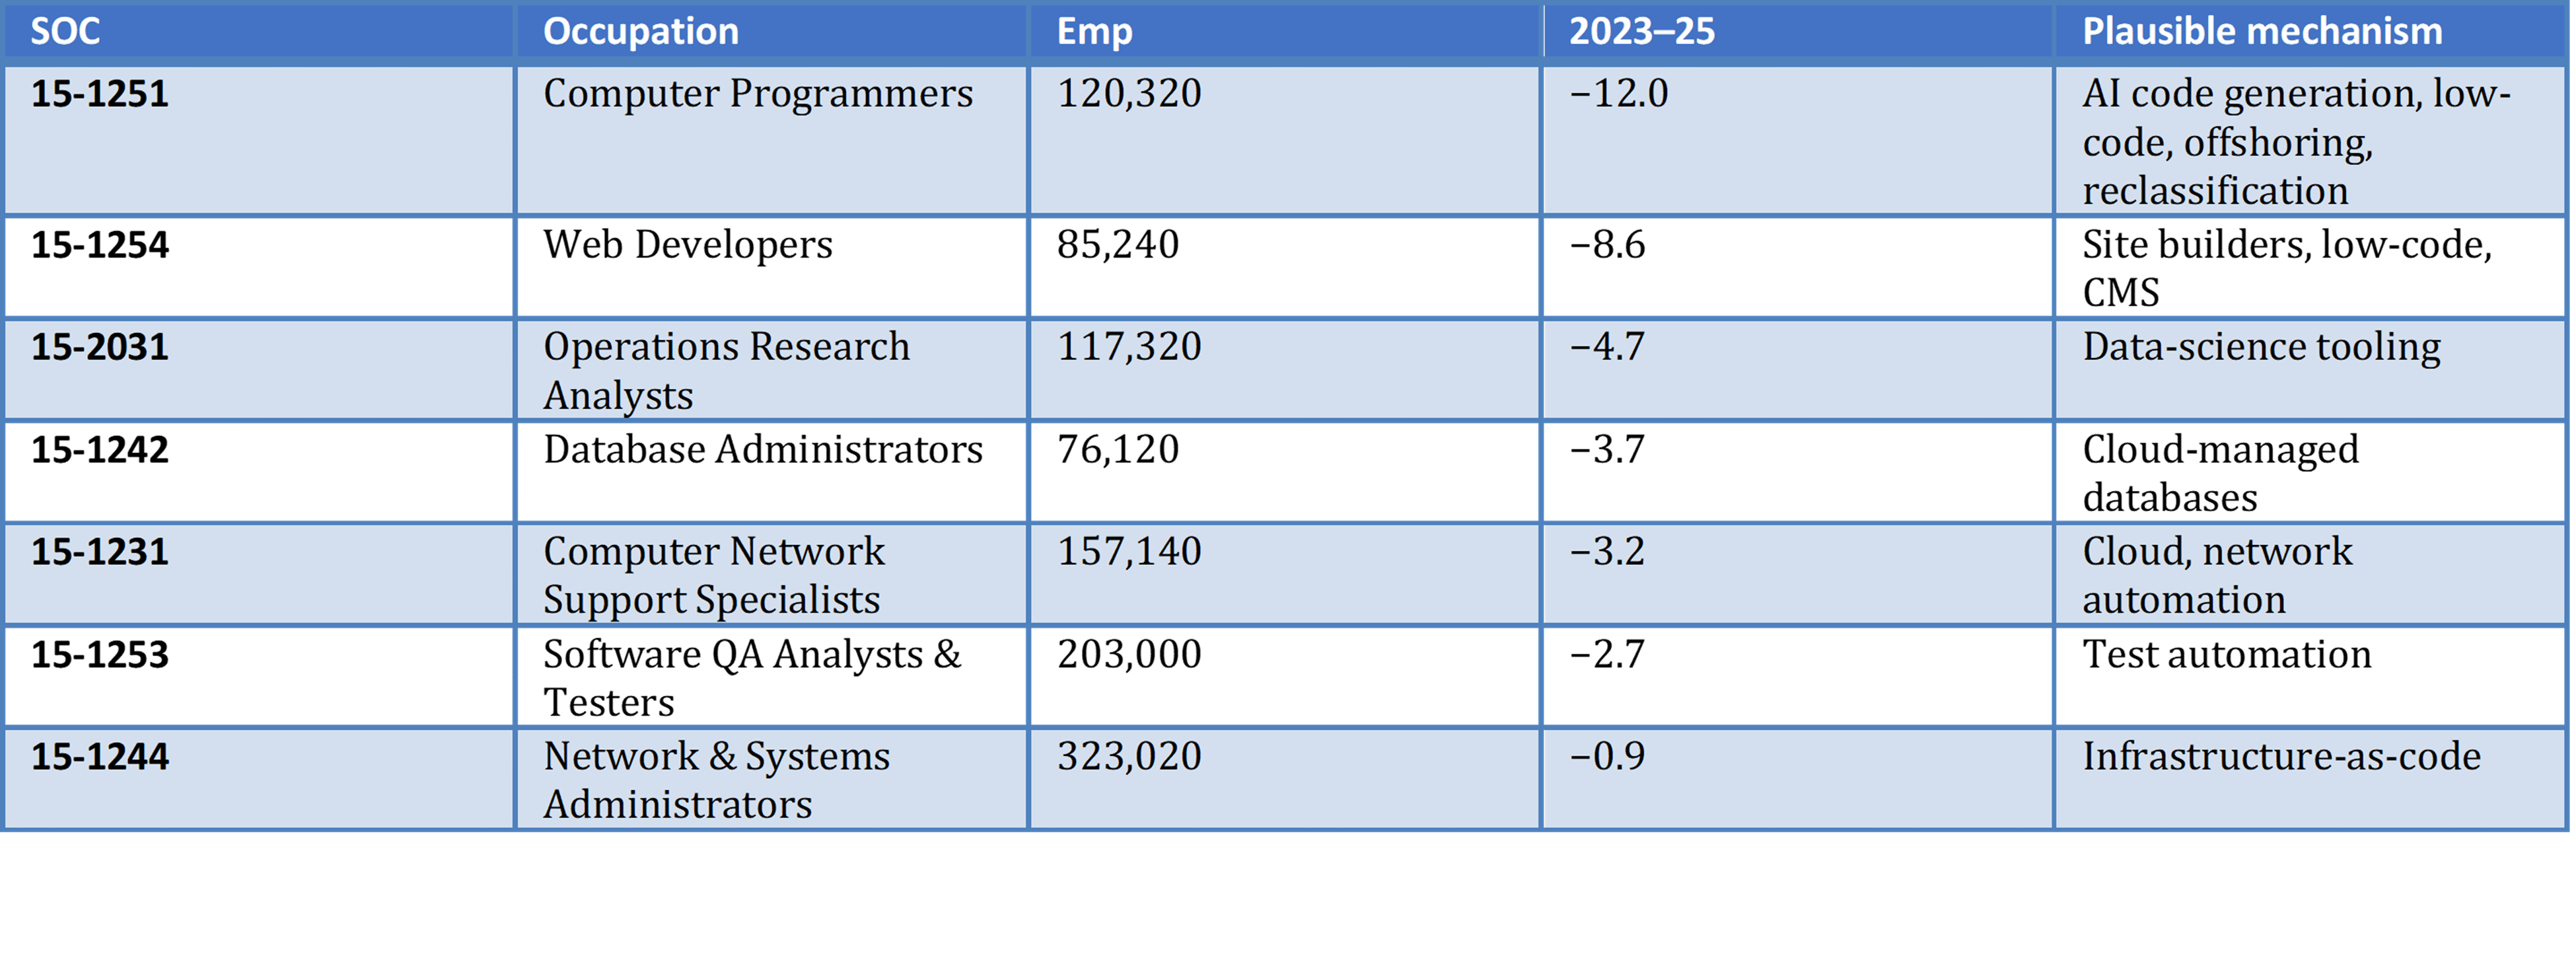
(This table shows one period only: the 2018 SOC revision renumbered and split the computing occupations, so a clean 2015–19 baseline can’t be reconstructed for this field.)
The labels need translation: a “Computer Programmer” writes code to a specification someone else designed, a “Software Developer” designs the software, and coding to spec is the slice easiest to codify, offshore, and automate. The build-and-maintain roles decline while over the same period Data Scientists grew about 17% a year, Information Security Analysts about 5%, and Software Developers about 2%. Two caveats keep me from calling even this “AI”: the 2022–23 sector-wide layoffs are only partly removed by the industry control, and part of the programmer decline is the long reclassification of “programmer” into “developer.”
Across all of these, the casualty is the procedural slice of the profession, and the judgment core beside it kept growing.
Most of the errors run one way
Nearly every material limitation here points toward understating a technology effect, not manufacturing one. The industry control itself removes the biggest channel: a technology effect that thins a whole sector’s occupations evenly is subtracted by construction, and part of an occupation’s own decline can migrate into the industry term. The data lag the technology: OEWS pools three years of industry by occupation information, so the “2023–25” figures barely contain 2025 and none of 2026, precisely when adoption accelerated. OEWS counts employees, not freelancers, so a designer who goes independent registers as a decline; that one runs the other way, and it’s why I treat the translator and designer declines as upper bounds until the household surveys, which do capture freelancers, confirm them. And the numbers are net, not gross: new technologies create jobs as well as eliminate them, often inside the same occupations, so a net decline understates the gross displacement underneath it. Almost everything this instrument misses points the same direction. The estimates above are a floor.
Method: industry-controlled growth is the occupation fixed effect from a weighted regression of log employment change on 2-digit-NAICS industry and occupation, using BLS OEWS national data, with occupations harmonized across the 2010→2018 SOC revision; figures are employment-weighted to the occupation group and annualized. Coverage is ~46% of employment (occupations identified across enough industries); single-industry occupations are excluded, not declared safe. This is correlation, not causation.
Technical appendix: the estimating equation is a weighted least-squares regression of the log employment change of occupation-by-industry cells on fixed effects for 2-digit-NAICS industry and detailed occupation, weighted by base-year employment. The occupation fixed effects are re-centered to an employment-weighted zero, so each figure reads as growth relative to the average job. Cells below 50 employees are dropped and changes are winsorized at the 1st and 99th percentiles. An occupation is reported only when spread across enough industries to identify its effect, measured by the effective number of industries (the inverse Herfindahl of its industry employment shares, required to be at least 2).
The codifiability argument is the right lens on what already happened — it explains the ordering. What it doesn't reach is the timing, and the timing is doing more work than the piece credits. A lot of the office and admin headcount now correcting was itself the artefact of a specific moment: organisations overbuilt through 2020 to 2022, hired ahead of demand they never fully tested, and by 2023 were carrying more customer service and admin capacity than the business justified. That correction was coming regardless of what AI could or couldn't do. AI arriving at the same moment didn't just accelerate the codifiable layer — it gave the correction a public explanation that "we overhired coming out of the pandemic" never gets. Naming AI as the cause reads better in a board pack than naming a hiring decision from three years earlier, and the industry control in this analysis has no way of telling those two stories apart.
The professional side of the picture holds up better. Codifiability is right as a predictor, but it's still a task-list description of what survives. What actually survives inside a role that keeps its judgement, its accountability, its persuasion is closer to a specific set of things a spec sheet was never built to capture: reading what a situation actually calls for, knowing when to bend the process rather than run it, carrying the ethical call nobody wrote down as a task. That was always the gap between a job description and the job. AI hasn't created that gap. It's just made it the only part of the role left standing.
Which raises the harder measurement problem for next year's release: if what survives is judgement rather than task, what does OEWS — or any occupational dataset built on task lists — actually have the vocabulary to count?